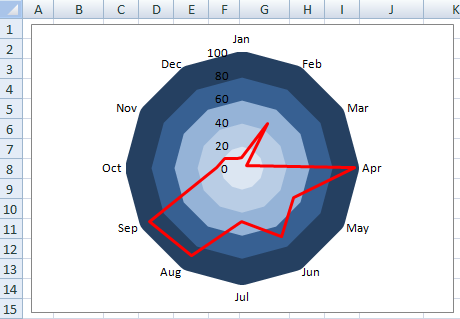
几天来,我一直在努力用 g2plot 在图像中实现像这样的渐变,我将不胜感激任何提示
这是我的示例代码
import { Radar } from "@antv/g2plot";

// 数据更新于 2021.01.09
const data = [
  { name: "G2", star: 1 },
  { name: "G6", star: 2 },
  { name: "F2", star: 8 },
  { name: "L7", star: 4 },
  { name: "X6", star: 5 },
  { name: "AVA", star: 2 },
  { name: "G2Plot", star: 3 }
];
const radarPlot = new Radar("container", {
  data: data,
  xField: "name",
  yField: "star",
  zFiled: "star",
  appendPadding: [0, 10, 0, 10],
  lineStyle: {
    r: {
      angleLines: {
        display: true
      }
    }
  },
  meta: {
    star: {
      alias: "star 数量",
      min: 0,
      nice: true,
      formatter: v => Number(v).toFixed(2)
    }
  },
  xAxis: {
    tickLine: null,
  },
  yAxis: {
    label: false,
    grid: {
      line: {
        style: (x, y) => {
          console.log(y);
          return {
            fill: "r(0.5,0.5,0.1) 0:#FFF  1:#FF0000",
            stroke: "#000",
            fillOpacity: 0.5,
            opacity: 0
          };
        }
      }
    }
  },
  // 开启辅助点
  point: {
    size: 2
  },
  area: {}
});
radarPlot.render();
似乎最后一个网格总是褪色,我不知道是什么原因造成的。我在 g2 提供的演示上尝试了多种配置,但没有一个能按我的意愿工作。