我正在使用 R 中的 ggplot2 绘制多个数据集。为了使绘图更易于比较,我设置了 y 尺度的限制,但事实证明,在绘图的“自然顶部”上方没有绘制任何内容.
例如对于这个情节:(
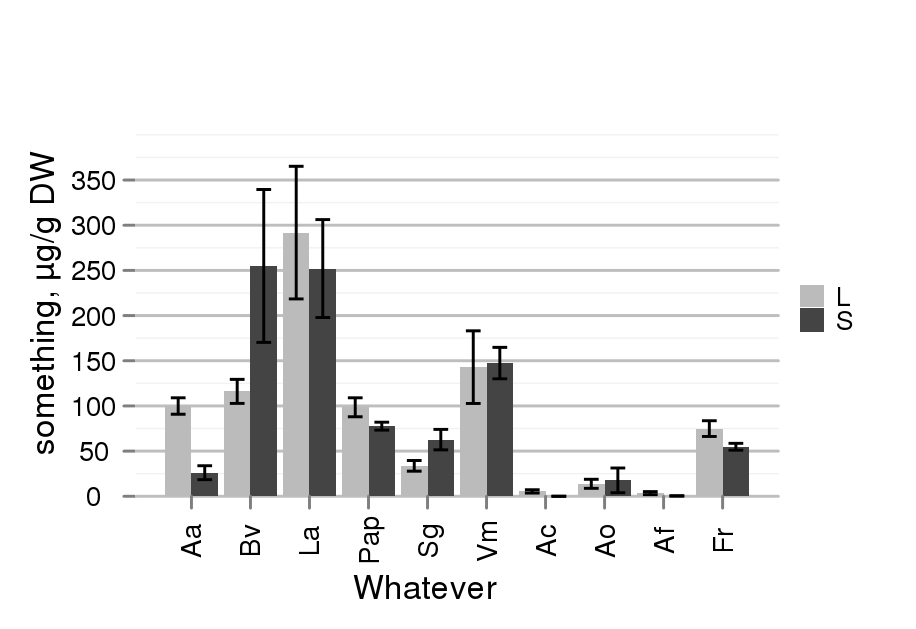
来源:sickel.net)
我试图将顶部 y 值设置为 500(并查看顶部的空白,我已经设法做到了)但是如何让 ggplot 也绘制 400,450 和 500 的标签以及相应的网格线?
数据位于数据帧 df 中,df$dataset 和 df$error 分别作为数据和错误级别。我目前的绘图代码是
max = max(df$dataset + df$error) * 1.05
if(max > 300) max=505

dataplot = ggplot(data=df, aes(x=species,y=dataset,fill=dim,ylim=c(0,max)))
dataplot = dataplot+geom_bar(position=position_dodge())
dataplot = dataplot+scale_fill_manual(values=c("#BBBBBB", "#444444"))
dataplot = dataplot + ylab(ylab) + xlab(xlab) + opts(legend.title=theme_blank())

limits <- aes(ymax = df$dataset+df$error, ymin=df$dataset-df$error)
dodge = position_dodge(width=0.9)

dataplot = dataplot + geom_errorbar(limits, position=dodge, width=0.5)
dataplot = dataplot + opts(panel.background = theme_rect(fill='white', colour='white'))
dataplot = dataplot + opts(panel.grid.major = theme_line(colour = "gray"))

# dataplot = dataplot + coord_cartesian(ylim=c(0, max))
# dataplot = dataplot + scale_y_continuous(limits=c(0, max))

dataplot = dataplot +
               opts(axis.text.x = theme_text(colour = "black",angle=90),
                    axis.text.y = theme_text(colour = "black"))
dataplot = dataplot + opts(legend.key.size = unit(0.3, "cm"))
print(dataplot)
从注释掉的行可以看出,我已经尝试了 coord_cartesian、scale_y_continous 以及当前的 y-lim,但没有任何运气(是的,我知道 coord_cartesian 正在放大)
