0

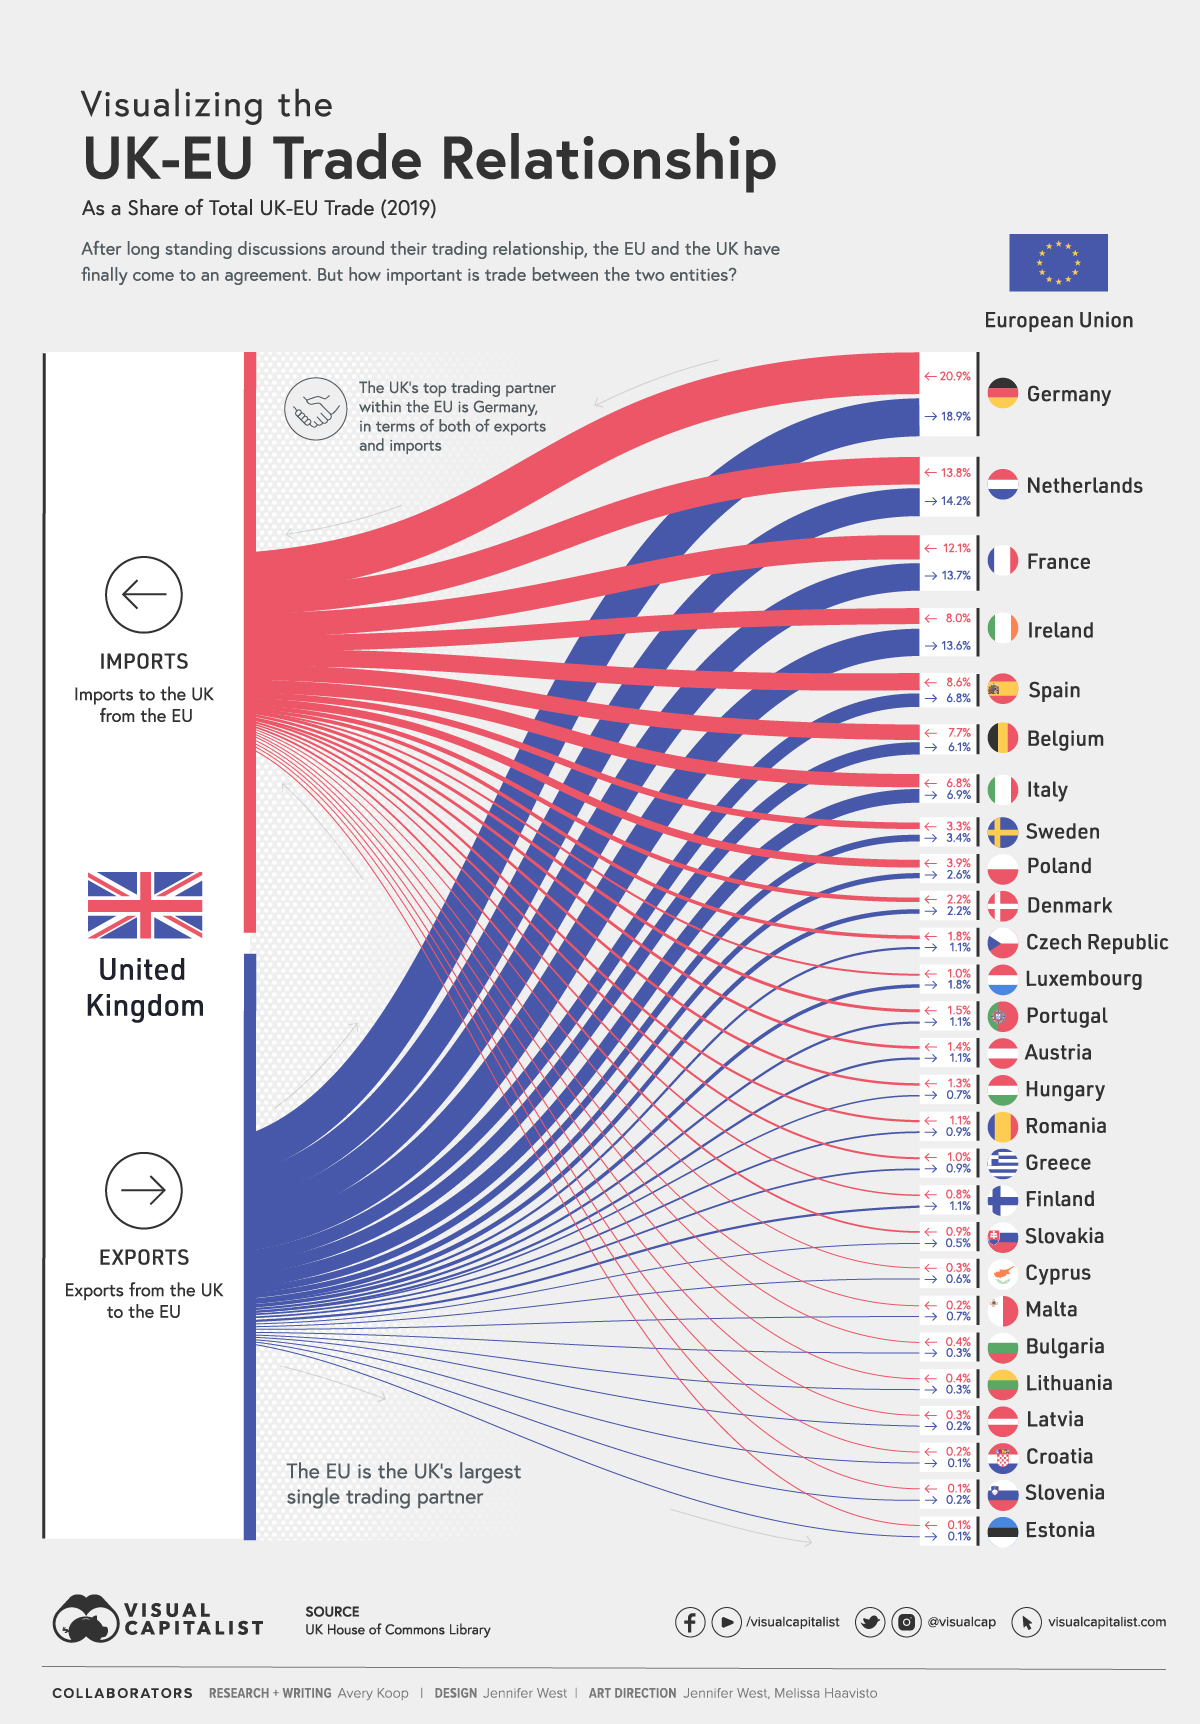
I am trying to reproduce somehow this chart UK plot with the ggalluvial package in R. But I do not know how to put the countries flags. I tried to create an ID variable as an y axis to use it with the ggflags package.

library(tidyverse)
library(ggalluvial)
#library(ggflags)


toy2 <- data.frame(
  stringsAsFactors = FALSE,
  subject = c(
    "A", "B", "C", "D", "E", "A",
    "B", "C", "D", "E", "A", "B", "C", "D", "E"
  ),
  collection2 = c(
    1, 1, 1, 1, 1, 3, 3, 3, 3, 3,
    3.33, 3.33, 3.33, 3.33, 3.33
  ),
  category2 = c(
    "Y", "X", "X", "Y", "X", "X",
    "Y", "Y", "Y", "X", "X", "Y", "Y", "Y", "X"
  ),
  category3 = c(
    "Y", "X", "X", "Y", "X", "X",
    "Y", "Y", "Y", "X", "ca", "ar", "ar", "ar", "ca"
  ),
  classes = c(
    "one",
    "one", "one", "two", "two", "one", "one", "one",
    "two", "two", "one", "one", "one", "two", "two"
  )
)

ggplot(toy2, aes(
  x = collection2,
  stratum = category2,
  alluvium = subject,
  country = category3,
)) +
  # scale_x_discrete(expand = c(.1, 0.2)) +
  geom_alluvium(aes(fill = classes)) +
  geom_stratum(color = "grey") +
  geom_text(
    stat = "stratum",
    aes(label = category3)
  ) +
  scale_fill_manual(values = c("#ED5667", "#4758AA")) +
  theme_void()

Created on 2021-03-03 by the reprex package (v0.3.0)

4

1 回答 1

0

I got the positions of the labels with the ggplot_build(), then I used them with ggglags

library(tidyverse)
library(ggalluvial)
library(ggflags)

toy2 <- data.frame(
  stringsAsFactors = FALSE,
  subject = c(
    "A", "B", "C", "D", "E", "A",
    "B", "C", "D", "E", "A", "B", "C", "D", "E"
  ),
  collection2 = c(
    1, 1, 1, 1, 1, 3, 3, 3, 3, 3,
    3.33, 3.33, 3.33, 3.33, 3.33
  ),
  category2 = c(
    "Y", "X", "X", "Y", "X", "X",
    "Y", "Y", "Y", "X", "X", "Y", "Y", "Y", "X"
  ),
  category3 = c(
    "Y", "X", "X", "Y", "X", "X",
    "Y", "Y", "Y", "X", "ca", "ar", "ar", "ar", "ca"
  ),
  classes = c(
    "one",
    "one", "one", "two", "two", "one", "one", "one",
    "two", "two", "one", "one", "one", "two", "two"
  )
)

p <- ggplot(toy2, aes(
  x = collection2,
  stratum = category2,
  alluvium = subject,
  country = category3,
)) +
  # scale_x_discrete(expand = c(.1, 0.2)) +
  geom_alluvium(aes(fill = classes)) +
  geom_stratum(color = "grey") +
  geom_text(
    stat = "stratum",
    aes(label = category3)
  ) +
  scale_fill_manual(values = c("#ED5667", "#4758AA")) +
  theme_void()

points <- ggplot_build(p) %>% 
  pluck("data") %>% 
  pluck(3) %>% 
  as_tibble() %>% 
  filter(label %in% c("ar", "ca")) %>% 
  mutate(category3 = label) %>% 
  mutate(category2 = stratum) %>% 
  mutate(collection2 = x) %>% 
  mutate(alluvium = NA) %>% 
  mutate(subject = NA)

p2 <-  p + geom_flag(
    data = points,
    aes(
      country = category3,
      y = y
    ),
    size = 20,
    color = "black"
  )
p2

Created on 2021-03-25 by the reprex package (v0.3.0)

于 2021-03-25T18:16:49.667 回答