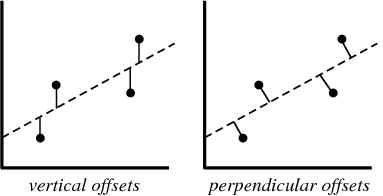
我有兴趣制作一个带有最小二乘回归线和将数据点连接到回归线的线段的图,如下图所示,称为垂直偏移:
http: //mathworld.wolfram.com/LeastSquaresFitting.html
(来自 MathWorld - Wolfram 网络资源:wolfram.com)
我在这里完成了绘图和回归线:
## Dataset from http://www.apsnet.org/education/advancedplantpath/topics/RModules/doc1/04_Linear_regression.html

## Disease severity as a function of temperature

# Response variable, disease severity
diseasesev<-c(1.9,3.1,3.3,4.8,5.3,6.1,6.4,7.6,9.8,12.4)

# Predictor variable, (Centigrade)
temperature<-c(2,1,5,5,20,20,23,10,30,25)

## For convenience, the data may be formatted into a dataframe
severity <- as.data.frame(cbind(diseasesev,temperature))

## Fit a linear model for the data and summarize the output from function lm()
severity.lm <- lm(diseasesev~temperature,data=severity)

# Take a look at the data
plot(
 diseasesev~temperature,
        data=severity,
        xlab="Temperature",
        ylab="% Disease Severity",
        pch=16,
        pty="s",
        xlim=c(0,30),
        ylim=c(0,30)
)
abline(severity.lm,lty=1)
title(main="Graph of % Disease Severity vs Temperature")
我应该使用某种 for 循环和段http://www.iiap.res.in/astrostat/School07/R/html/graphics/html/segments.html来进行垂直偏移吗?有没有更有效的方法?如果可能,请提供一个例子。