不久前,我参与了一个项目,该项目在 R 中完成了非常相似的事情。这是一个显示概念验证的视频示例(无音频)。 https://www.screencast.com/t/xa0yemiDPl
它实质上显示了使用 Tableau 以交互方式检查所选国家/地区的词云中的葡萄酒描述的最终状态。关键组件是:
- 让 Tableau 连接到要分析的数据,以及一个占位符数据集,该数据集包含您希望从 Python/R 代码返回的记录数(从 Tableau 调用 Python/R 期望返回相同数量的它发送去处理的记录......如果您发送文本数据,但处理它以返回更多记录,这可能会出现问题 - 就像文字云示例中的情况一样)
- 让 Python/R 代码连接到您的数据并在单个向量中返回单词和频率计数,并用分隔符分隔(Tableau 对词云的要求)
- 使用 Tableau 计算字段拆分单个向量
- 利用参数操作来选择参数值以传递给 Python/R 代码
高级概述
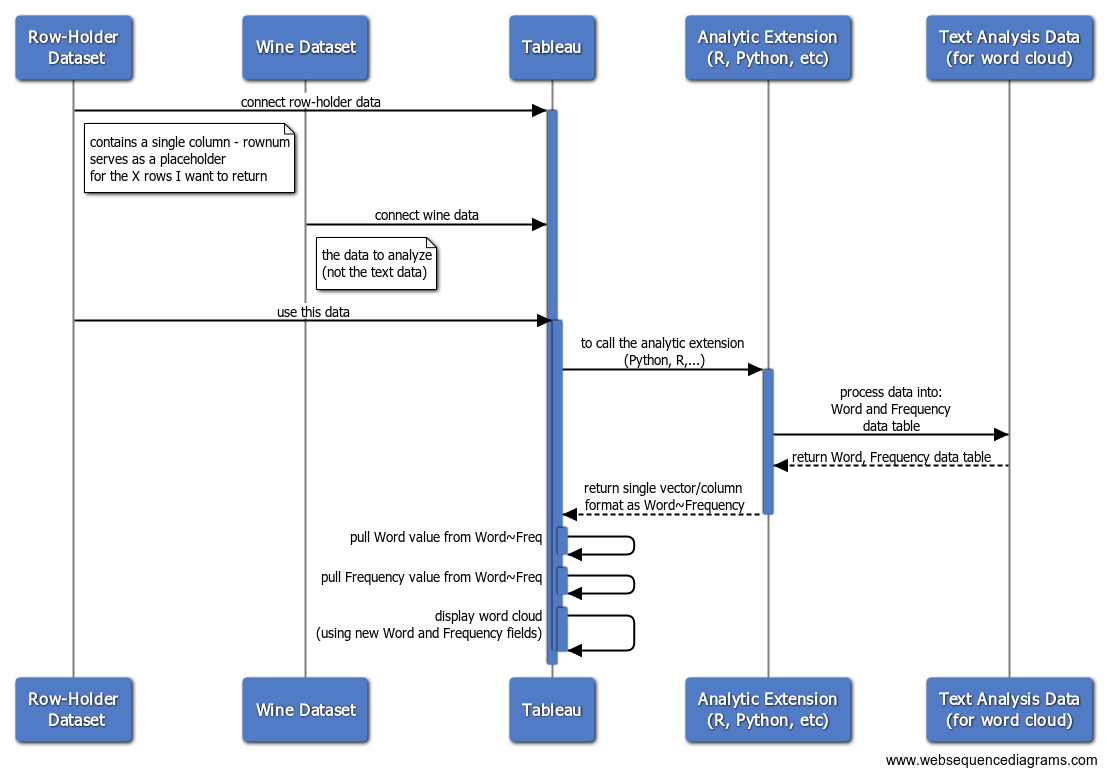
Tableau 计算字段 - [R 字数+频率]:
Script_Str('
print("STARTING NEW SCRIPT RUN")
print(Sys.time())
print(.arg2) # grouping
print(.arg1) # selected country


# TEST VARIABLE (non-prod)
.MaxSourceDataRecords = 1000 # -1 to disable

# TABLEAU PARAMETER VARIABLES
.country = "' + [Country Parameter] + '"
.wordsToReturn = ' + str([Return Top N Words]) + '
#^^^^^^^^^^^^^^^^^^^^^^^^^^^^^^^^^^^^^^^^^^^^^^^^^^^#

# VARIABLES DERIVED FROM TABLEAU PARAMETER VALUES
.countryUseAll = (.country == "All")
print(.countryUseAll)
#^^^^^^^^^^^^^^^^^^^^^^^^^^^^^^^^^^^^^^^^^^^^^^^^^^^#

#setwd("C:/Users/jbelliveau/....FILL IN HERE...")
.fileIn = ' + [Source Data Path] + '
#.fileOut = "winemag-with-DTM.csv"

#install.packages("wordcloud")
#install.packages("RColorBrewer") # not needed if installed wordcloud package

library(tm)
library(wordcloud)
library(RColorBrewer) # color package (maps or wordclouds)

wineAll = read.csv(.fileIn, stringsAsFactors=FALSE)

# TODO separately... polarity

# use all the data or just the parameter selected
print(.countryUseAll)

if ( .countryUseAll ) {
  wine = wineAll # filter down to parameter passed from Tableau
}else{
  wine = wineAll[c(wineAll$country == .country),] # filter down to parameter passed from Tableau
}

# limited data for speed (NOT FOR PRODUCTION)
if( .MaxSourceDataRecords > 0 ){
  print("limiting the number of records to use from input data")
  wine = head(wine, .MaxSourceDataRecords)
}


corpus = Corpus(VectorSource(wine$description))
corpus = tm_map(corpus, tolower)
#corpus = tm_map(corpus, PlainTextDocument) # https://stackoverflow.com/questions/32523544/how-to-remove-error-in-term-document-matrix-in-r/36161902
corpus = tm_map(corpus, removePunctuation)
corpus = tm_map(corpus, removeWords, stopwords("English"))
#length(corpus)

dtm = DocumentTermMatrix(corpus)

#?sample
mysample = dtm # no sampling (used Head on data read... for speed/simplicity on this example)
#mysample <- dtm[sample(1:nrow(dtm), 5000, replace=FALSE),]
#nrow(mysample)
wineSample = as.data.frame(as.matrix(mysample))

# column names (the words)
# use colnames to get a vector of the words
#colnames(wineSample)

# freq of words
# colSums to get the frequency of the words
#wineWordFreq = colSums(wineSample)

# structure in a way Tableau will like it
wordCloudData = data.frame(words=colnames(wineSample), freq=colSums(wineSample))
str(wordCloudData)

# sort by word freq
wordCloudDataSorted = wordCloudData[order(-wordCloudData$freq),]

# join together by ~ for processing once Tableau gets it
wordAndFreq = paste(wordCloudDataSorted[, 1], wordCloudDataSorted[, 2], sep = "~")

#write.table(wordCloudData, .fileOut, sep=",",row.names=FALSE) # if needed for performance refactors

topWords = head(wordAndFreq, .wordsToReturn)
#print(topWords)

return( topWords )

',
Max([Country Parameter])
, MAX([RowNum]) // for testing the grouping being sent to R
)
单词值的 Tableau 计算字段:
// grab the first token to the left of ~
Left([R Words+Freq], Find([R Words+Freq],"~") - 1)
频率值的 Tableau 计算字段:
INT(REPLACE([R Words+Freq],[Word]+"~",""))
如果您不熟悉 Tableau,您可能希望与贵公司的 Tableau 分析师一起工作。他们将能够帮助您创建计算字段并配置 Tableau 以连接到 TabPy。