我试图使用 Python 模拟“样本比例的抽样分布”。我尝试使用伯努利变量,如示例here
关键是,在大量的口香糖中,我们有真正比例为0.6的黄色球。如果我们抽取样本(一些大小,比如 10 个),取其平均值并绘图,我们应该得到一个正态分布。
我设法获得了正常的采样分布,但是,具有相同 mu 和 sigma 的实际正常连续曲线根本不适合,而是放大到几个因子。我不确定是什么原因造成的,理想情况下它应该非常适合。下面是我的代码和输出。我尝试改变幅度和 sigma(除以 sqrt(samplesize))但没有任何帮助。请帮忙。
代码:
from SDSP import create_bernoulli_population, get_frequency_df
from random import shuffle, choices
from bi_to_nor_demo import get_metrics, bare_minimal_plot
import matplotlib.pyplot as plt


N = 10000  # 10000 balls
p = 0.6    # probability of yellow ball is 0.6, and others (1-0.6)=>0.4
n_pickups = 10       # sample size
n_experiments = 2000  # I dont know what this is called


# STATISTICAL PDF
# choose sample, take mean and add to X_mean_list. Do this for n_experiments times.
X_hat = []
X_mean_list = []
for each_experiment in range(n_experiments):
    X_hat = choices(population, k=n_pickups)  # choose, say 10 samples from population (with replacement)
    X_mean = sum(X_hat)/len(X_hat)
    X_mean_list.append(X_mean)
stats_df = get_frequency_df(X_mean_list)


# plot both theoretical and statistical outcomes
fig, ax = plt.subplots(1,1, figsize=(5,5))
from SDSP import plot_pdf
mu,var,sigma = get_metrics(stats_df)
plot_pdf(stats_df, ax, n_pickups, mu, sigma, p=mu, bar_width=round(0.5/n_pickups,3),
         title='Sampling Distribution of\n a Sample Proportion')
plt.tight_layout()
plt.show()
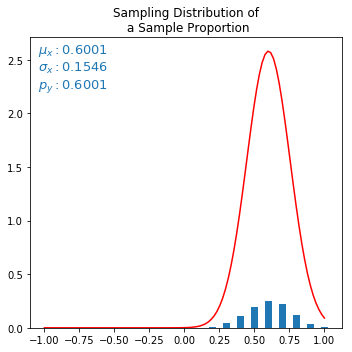
输出:
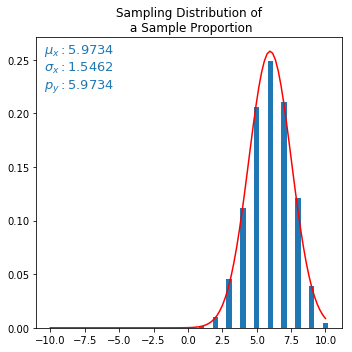
红色曲线是失配正态逼近曲线。mu 和 sigma 来自统计离散分布(小蓝条),并馈送到计算正态曲线的公式。但正常曲线看起来以某种方式放大了。
更新:
避免除以取平均值,解决了图形问题,但 mu 被缩放。所以问题还没有完全解决。:(
X_mean = sum(X_hat) # removed the division /len(X_hat)
删除上述除法后的输出(但需要吗?):