I've recently been working on a project involving Chart.JS. I'm looking to scale the x-axis so that 50% width goes from values 0-100 while the other 50% width of the chart goes from 100 - 1000.
I'm using a horizontal stacked bar chart with 3 datasets. This can be seen here
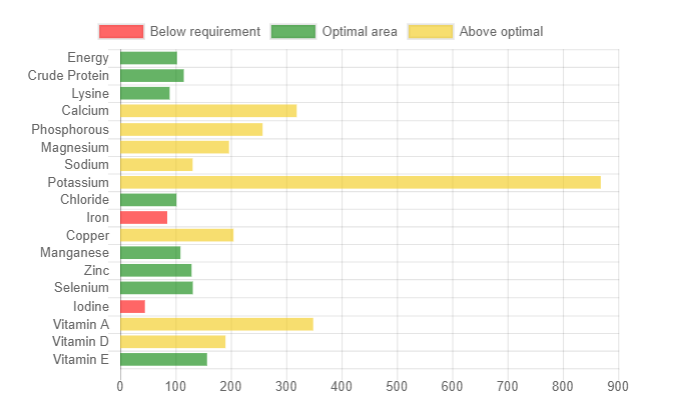
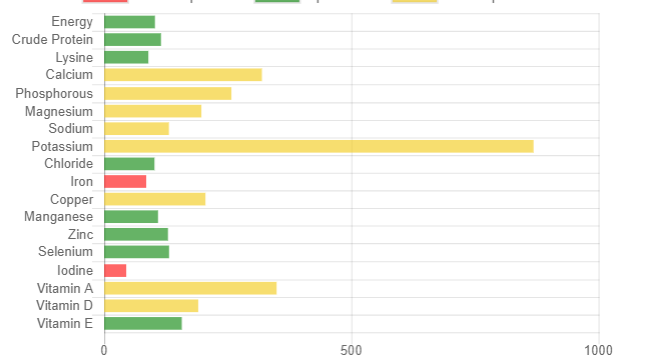
What I'm trying to achieve is something like this here, except the 500 would be 100 and the 1000 would remain 1000. i.e. the graph wouldn't have a linear scale.
I'm attempting to do this as anything above around 150 is pretty much an outlier and I'm not worried about it going over 1000.
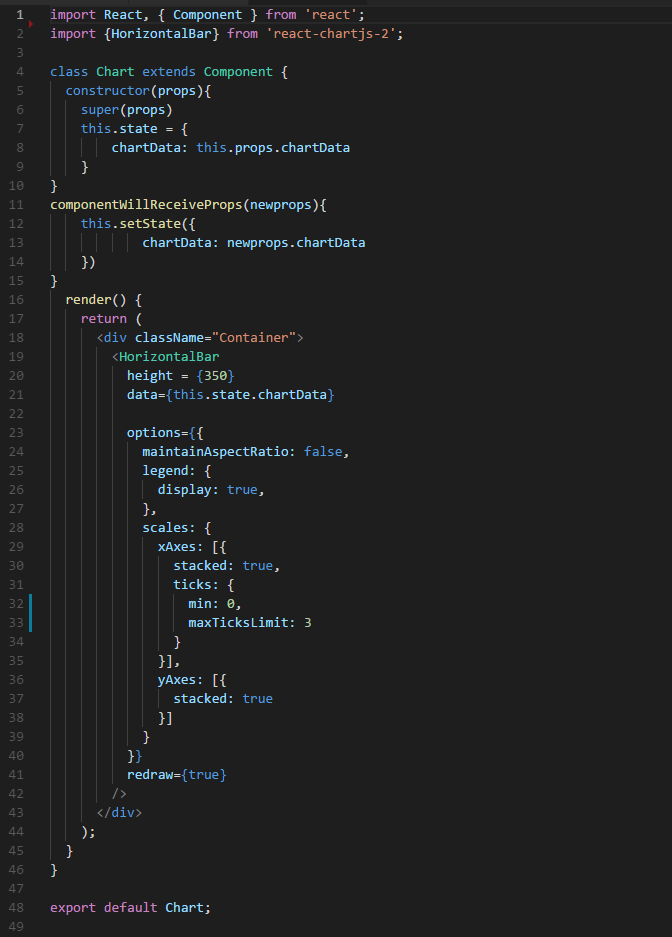
Here is my current config for the chart (I'm using react-chartjs and react)
I've react the documentation on chart.js and viewed some GitHub issue posts but can't find to find anyone with a similar problem. Maybe I'm misunderstanding one of the properties of the ticks object.
Anyway, thanks to everyone and anyone that replies! Will edit once I find a solution.
Chart Config Code Block
options= {{
    maintainAspectRatio: false,
    legend: {
        display: true,
    },
    scales: {
        xAxes: [{
            stacked: true,
            ticks: {
                min: 0,
                maxTicksLimit: 3
            }
        }],
        yAxes: [{
            stacked: true
        }]
    }
}}