0

我有一个非常大的 pandas DataFrame,其中包含数千个代码以及与每个代码相关的成本(示例):

data = {'code': ['a', 'b', 'a', 'c', 'c', 'c', 'c'],
        'cost': [10, 20, 100, 10, 10, 500, 10]}
df = pd.DataFrame(data)

groupby在级别创建一个对象code,即:

grouped = df.groupby('code')['cost'].agg(['sum', 'mean']).apply(pd.Series)

现在我真的需要在这个groupedDataFrame 中添加一个新列,以确定具有异常成本的代码的百分比。我最初的方法是这个外部函数(使用iqrfrom scipy):

def is_outlier(s):
    # Only calculate outliers when we have more than 100 observations
    if s.count() >= 100:
        return np.where(s >= s.quantile(0.75) + 1.5 * iqr(s), 1, 0).mean()
    else:
        return np.nan

编写完这个函数后,我在上面添加is_outlier了我的agg论点groupby。这不起作用,因为我正在尝试为系列is_outlier中的每个元素评估此比率cost

grouped = df.groupby('code')['cost'].agg(['sum', 'mean', is_outlier]).apply(pd.Series)

我尝试使用pd.Series.where,但它没有与np.where. 有没有办法修改我的is_outlier函数,该函数必须将cost系列作为参数才能正确评估每个代码的异常值率?还是我完全偏离了道路?

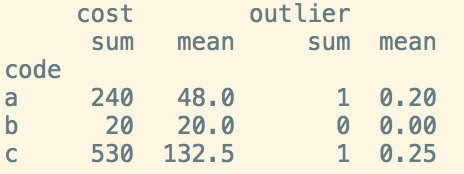
更新期望结果(减去此示例的最低观察要求):

>>> grouped

  code    sum    mean    is_outlier

0  'a'    110     55     0.5
1  'b'    20      20     0
2  'c'    530     132.5  0.25

注意:为了让我计算异常值,我的样本很糟糕,因为我分别有 2、1 和 4 个观察值code。在生产数据框中,每个代码都有成百上千的观察结果,每个观察结果都与成本相关。在上面的示例结果中,平均值的值is_outlier意味着,对于'a'两个观察值中的一个在异常值范围内的成本,对于'c'四个观察值中的一个在异常值范围内的成本,等等 - 我正在尝试重新创建这个在我的函数中,通过分配 1 和 0 作为结果np.where()并取.mean()那个

.apply(pd.Series)需要为了转换<pandas.core.groupby.SeriesGroupBy object> resulting fromgroupbyinto a DataFrame.is a pandas Series with all values of成本for each代码, as generated from thegroupby operation (split phase ofsplit-apply-combine`)

4

1 回答 1

0

使用的数据

# Loading Libraries
import pandas as pd;
import numpy as np;

# Creating Data set
data = {'code': ['a', 'b', 'a', 'c', 'c', 'c', 'c', 'a', 'a', 'a'],
    'cost': [10, 20, 200, 10, 10, 500, 10, 10, 10, 10]}

df = pd.DataFrame(data)

定义用于计算指定列中异常值比例的函数

def outlier_prop(df,name,group_by):

    """
    @Packages required
    import pandas as pd;
    import numpy as np;

    @input
    df = original dataframe
    name = This is the name column for which you want the dummy list
    group_by = column to group by

    @output
    data frame with an added column 'outlier' containing the proportion of outliers
    """

    # Step 1: Create a dict of values for each group
    value_dict = dict()
    for index,i in enumerate(df[group_by]):
        if i not in value_dict.keys():
            value_dict[i] = [df[name][index]]
        else:
            value_dict[i].append(df[name][index])

    # Step 2: Calculate the outlier value for each group and store as a dict
    outlier_thres_dict = dict()
    unique_groups = set(df[group_by])
    for i in unique_groups:
        outlier_threshold = np.mean(value_dict[i]) + 1.5*np.std(value_dict[i])
        outlier_thres_dict[i] = outlier_threshold

    # Step 3: Create a list indicating values greater than the group specific threshold
    dummy_list = []
    for index,i in enumerate(df[group_by]):
        if df[name][index] > outlier_thres_dict[i]:
            dummy_list.append(1)
        else:
            dummy_list.append(0)

    # Step 4: Add the list to the original dataframe
    df['outlier'] = dummy_list

    # Step 5: Grouping and getting the proportion of outliers
    grouped = df.groupby(group_by).agg(['sum', 'mean']).apply(pd.Series)

    # Step 6: Return data frame
    return grouped

调用函数

outlier_prop(df, 'cost', 'code')

输出

https://raw.githubusercontent.com/magoavi/stackoverflow/master/50533570.png

于 2018-05-25T18:19:05.780 回答