6

我正在以编程方式制作大量的seqlogos。它们有数百列宽,因此运行seqlogo通常会创建太薄而无法看到的字母。我注意到我只关心其中的一些列(不一定是连续的列)......大多数都是噪音,但有些是高度保守的。

我使用类似这样的片段:

wide_seqs = cell2mat(arrayfun(@randseq, repmat(200, [500 1]), 'uniformoutput', false));
wide_seqs(:, [17,30, 55,70,130]) = repmat(['ATCGG'], [500 1])

conserve_cell = seqlogo(wide_seqs, 'displaylogo', false);
high_bit_cols = any(conserve_cell{2}>1.0,1);
[~, handle] = seqlogo(wide_seqs(:,high_bit_cols ));

虽然当我这样做时,我会丢失有关数据来自哪些列的信息。

通常我只会更改seqlogo. 但是,seqlogo's 是某种疯狂的基于 java 的对象,调用如下:

set(handle, 'xticklabel', num2str(find(high_bit_cols)))

不工作。任何帮助将不胜感激。

谢谢,威尔

编辑:

在赏金上,我愿意接受任何一种更改轴标签的疯狂方法,包括(但不限于):使用图像处理工具箱在保存后修改图像,使用文本框创建新的 seqlogo 函数,修改java 代码(如果可能的话)等。我不愿意接受诸如“使用 python”、“使用这个 R 库”或任何其他类型的非 Matlab 解决方案之类的东西。

4

5 回答 5

5

好的,我为这个问题杀死了几个小时。看来您不能将任何 MATLAB 对象(轴或文本框)放在该 hgjavacomponent 对象的顶部。当然,我不能修改 java 代码。所以我找到的唯一可行的解​​决方案是从头开始创建图形。

我不想重写代码来计算权重矩阵(符号高度),你已经这样做了。但是,如果您根本不想使用 MATLAB 的 seqlogo,也可以这样做。所以我稍微改变了你的最后一行以获得矩阵:

[wm, handle] = seqlogo(wide_seqs(:,high_bit_cols ));

文本符号的问题是您无法精确控制它们的大小,无法将符号适合文本框。这可能是 MATLAB 决定使用 java 图形对象的原因。但是我们可以创建符号图像并处理它们。

这是创建字母图像的代码:

letters = wm{1};
clr = [0 1 0; 0 0 1; 1 0.8 0;1 0 0]; % corresponding colors
for t = 1:numel(letters)
    hf = figure('position',[200 200 100 110],'color','w');
    ha = axes('parent',hf, 'visible','off','position',[0 0 1 1]);
    ht = text(50,55,letters(t),'color',clr(t,:),'units','pixels',...
        'fontsize',100,'fontweight','norm',...
        'vertical','mid','horizontal','center');
    F = getframe(hf); % rasterize the letter
    img = F.cdata;
    m = any(img < 255,3); % convert to binary image
    m(any(m,2),any(m,1))=1; % mask to cut white borders
    imwrite(reshape(img(repmat(m,[1 1 3])),[sum(any(m,2)) sum(any(m,1)) 3]),...
        [letters(t) '.png'])
    close(hf)
end

然后我们使用这些图像绘制新的 seqlogo 图:

xlabels = cellstr(num2str(find(high_bit_cols)'));
letters = wm{1};
wmat=wm{2}; % weight matrix from seqlogo
[nletters  npos] = size(wmat);
wmat(wmat<0) = 0; % cut negative values

% prepare the figure
clf
hAx = axes('parent',gcf,'visible','on');
set(hAx,'XLim',[0.5 npos+0.5],'XTick',1:npos,'XTickLabel',xlabels)
ymax = ceil(max(sum(wmat)));
ylim([0 ymax])
axpos = get(hAx,'Position');
step = axpos(3)/npos;

% place images of letters
for i=1:npos
    [wms idx] = sort(wmat(:,i)); % largest on the top
    let_show = letters(idx);
    ybot = axpos(2);
    for s=1:nletters
        if wms(s)==0, continue, end;
        axes('position',[axpos(1) ybot step wms(s)/ymax*axpos(4)])
        ybot = ybot + wms(s)/ymax*axpos(4);
        img = imread([let_show(s) '.png']);
        image(img)
        set(gca,'visible','off')
    end
    axpos(1)=axpos(1)+step;
end

结果如下: 替代文字 http://img716.imageshack.us/img716/2073/seqlogoexample.png

当然,代码和图形可以进一步改进,但我希望这是你可以开始使用的东西。如果我错过了什么,请告诉我。

于 2010-03-30T15:44:01.007 回答
4

我遇到了yuk尝试从SEQLOGO修改图形时遇到的相同问题,所以这是我在自己的版本中尝试模仿其外观的尝试。这是一个seqlogo_new.m您提供两个参数的函数:您的序列和可选的最小位值。它需要一个ACGT.jpg可以在此链接中找到的图像文件。

这是该函数的代码:

function hFigure = seqlogo_new(S,minBits)
%# SEQLOGO_NEW   Displays sequence logos for DNA.
%#   HFIGURE = SEQLOGO_NEW(SEQS,MINBITS) displays the
%#   sequence logo for a set of aligned sequences SEQS,
%#   showing only those columns containing at least one
%#   nucleotide with a minimum bit value MINBITS. The
%#   MINBITS parameter is optional. SEQLOGO_NEW returns
%#   a handle to the rendered figure HFIGURE.
%#
%#   SEQLOGO_NEW calls SEQLOGO to perform some of the
%#   computations, so to use this function you will need
%#   access to the Bioinformatics Toolbox.
%#
%#   See also seqlogo.

%# Author: Ken Eaton
%# Version: MATLAB R2009a
%# Last modified: 3/30/10
%#---------------------------------------------------------

  %# Get the weight matrix from SEQLOGO:

  W = seqlogo(S,'DisplayLogo',false);
  bitValues = W{2};

  %# Select columns with a minimum bit value:

  if nargin > 1
    highBitCols = any(bitValues > minBits,1);  %# Plot only high-bit columns
    bitValues = bitValues(:,highBitCols);
  else
    highBitCols = true(1,size(bitValues,2));   %# Plot all columns
  end

  %# Sort the bit value data:

  [bitValues,charIndex] = sort(bitValues,'descend');  %# Sort the columns
  nSequence = size(bitValues,2);                      %# Number of sequences
  maxBits = ceil(max(bitValues(:)));                  %# Upper plot limit

  %# Break 4-letter image into a 1-by-4 cell array of images:

  imgACGT = imread('ACGT.jpg');                %# Image of 4 letters
  [nRows,nCols,nPages] = size(imgACGT);        %# Raw image size
  letterIndex = round(linspace(1,nCols+1,5));  %# Indices of letter tile edges
  letterImages = {imgACGT(:,letterIndex(1):letterIndex(2)-1,:), ...
                  imgACGT(:,letterIndex(2):letterIndex(3)-1,:), ...
                  imgACGT(:,letterIndex(3):letterIndex(4)-1,:), ...
                  imgACGT(:,letterIndex(4):letterIndex(5)-1,:)};

  %# Create the image texture map:

  blankImage = repmat(uint8(255),[nRows round(nCols/4) 3]);  %# White image
  fullImage = repmat({blankImage},4,2*nSequence-1);  %# Cell array of images
  fullImage(:,1:2:end) = letterImages(charIndex);    %# Add letter images
  fullImage = cat(1,cat(2,fullImage{1,:}),...        %# Collapse cell array
                    cat(2,fullImage{2,:}),...        %#   to one 3-D image
                    cat(2,fullImage{3,:}),...
                    cat(2,fullImage{4,:}));

  %# Initialize coordinates for the texture-mapped surface:

  X = [(1:nSequence)-0.375; (1:nSequence)+0.375];
  X = repmat(X(:)',5,1);     %'# Surface x coordinates
  Y = [zeros(1,nSequence); cumsum(flipud(bitValues))];
  Y = kron(flipud(Y),[1 1]);  %# Surface y coordinates
  Z = zeros(5,2*nSequence);   %# Surface z coordinates

  %# Render the figure:

  figureSize = [602 402];                   %# Figure size
  screenSize = get(0,'ScreenSize');         %# Screen size
  offset = (screenSize(3:4)-figureSize)/2;  %# Offset to center figure
  hFigure = figure('Units','pixels',...
                   'Position',[offset figureSize],...
                   'Color',[1 1 1],...
                   'Name','Sequence Logo',...
                   'NumberTitle','off');
  axes('Parent',hFigure,...
       'Units','pixels',...
       'Position',[60 100 450 245],...
       'FontWeight','bold',...
       'LineWidth',3,...
       'TickDir','out',...
       'XLim',[0.5 nSequence+0.5],...
       'XTick',1:nSequence,...
       'XTickLabel',num2str(find(highBitCols)'),...  %'
       'YLim',[-0.03 maxBits],...
       'YTick',0:maxBits);
  xlabel('Sequence Position');
  ylabel('Bits');
  surface(X,Y,Z,fullImage,...
          'FaceColor','texturemap',...
          'EdgeColor','none');
  view(2);

end

以下是它的一些用法示例:

S = ['ATTATAGCAAACTA'; ...  %# Sample data
     'AACATGCCAAAGTA'; ...
     'ATCATGCAAAAGGA'];
seqlogo_new(S);             %# A normal plot similar to SEQLOGO

替代文字

seqlogo_new(S,1);        %# Plot only columns with bits > 1

替代文字

于 2010-03-30T16:15:18.230 回答
3

因此,我使用 yuk 和 gnovice 的解决方案创建了另一个解决方案。当我玩弄这个解决方案时,我意识到我真的希望能够将输出用作“子图”并能够任意更改字母的颜色。

由于 yuk 使用嵌入了字母的编程放置的轴对象,因此修改他的代码以绘制到任意轴对象会非常烦人(尽管并非不可能)。由于 gnovice 的解决方案是从预先创建的文件中读取字母,因此很难修改代码以针对任意颜色方案或字母选择运行。所以我的解决方案使用了yuk解决方案中的“字母生成”代码和gnovice解决方案中的“图像叠加”方法。

还有大量的参数解析和检查。以下是我的综合解决方案......我只是为了完整性而将其包括在内,我显然无法赢得自己的赏金。我将让社区决定奖励,并在时限结束时将赏金奖励给评分最高的人......如果出现平局,我会将其奖励给代表最低的人(他们可能更“需要”它)。

function [npos, handle] = SeqLogoFig(SEQ, varargin)
%   SeqLogoFig
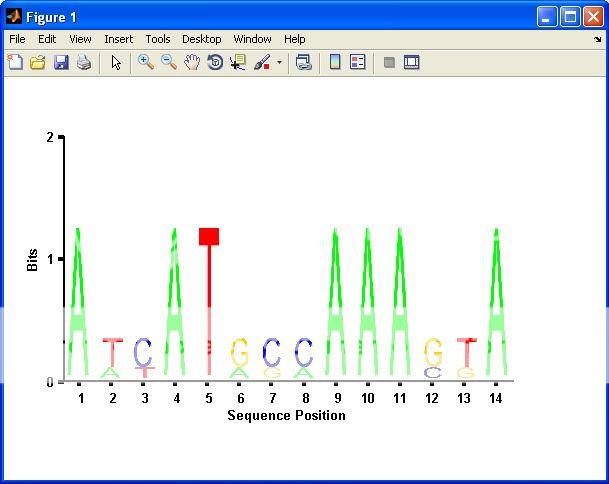
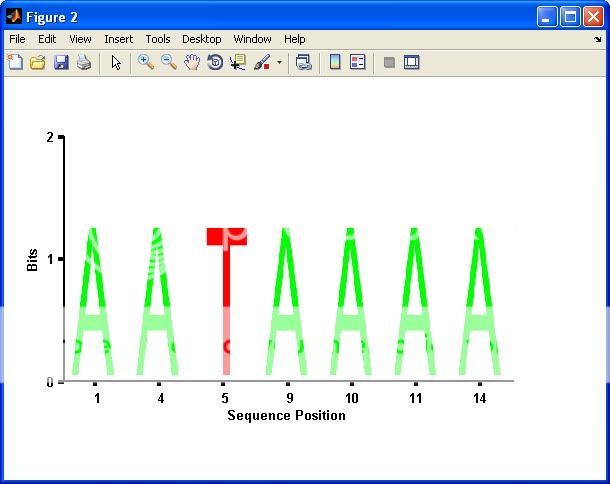
%       A function which wraps around the bioinformatics SeqLogo command
%       and creates a figure which is actually a MATLAB figure.  All
%       agruements for SEQLOGO are passed along to the seqlogo calculation.
%       It also supports extra arguements for plotting.
%
%   [npos, handle] = SeqLogoFig(SEQ);
%
%       SEQ             A multialigned set of sequences that is acceptable
%                       to SEQLOGO.
%       npos            The positions that were actually plotted
%       handle          An axis handle to the object that was plotted.
%
%   Extra Arguements:
%       
%       'CUTOFF'        A bit-cutoff to use for deciding which columns to
%                       plot.  Any columns that have a MAX value which is
%                       greater than CUTOFF will be provided.  Defaults to
%                       1.25 for NT and 2.25 for AA.
%
%       'TOP-N'         Plots only the top N columns as ranked by thier MAX
%                       bit conservation.
%
%       'AXES_HANDLE'   An axis handle to plot the seqlogo into.
%       
%       'INDS'          A set of indices to to plot.  This overrides any
%                       CUTOFF or TOP-N that were provided
%
%
%
%

%% Parse the input arguements
ALPHA = 'nt';
MAX_BITS = 2.5;
RES = [200 80];
CUTOFF = [];
TOPN = [];
rm_inds = [];
colors = [];
handle = [];
npos = [];


for i = 1:2:length(varargin)
    if strcmpi(varargin{i}, 'alphabet')
        ALPHA = varargin{i+1};

    elseif strcmpi(varargin{i}, 'cutoff')
        CUTOFF = varargin{i+1};
        %we need to remove these so seqlogo doesn't get confused
        rm_inds = [rm_inds i, i+1]; %#ok<*AGROW>

    elseif strcmpi(varargin{i}, 'colors')
        colors = varargin{i+1};
        rm_inds = [rm_inds i, i+1]; 
    elseif strcmpi(varargin{i}, 'axes_handle')
        handle = varargin{i+1};
        rm_inds = [rm_inds i, i+1]; 
    elseif strcmpi(varargin{i}, 'top-n')
        TOPN = varargin{i+1};
        rm_inds = [rm_inds i, i+1];
    elseif strcmpi(varargin{i}, 'inds')
        npos = varargin{i+1};
        rm_inds = [rm_inds i, i+1];
    end
end

if ~isempty(rm_inds)
    varargin(rm_inds) = [];
end

if isempty(colors)
    colors = GetColors(ALPHA);
end

if strcmpi(ALPHA, 'nt')
    MAX_BITS = 2.5;
elseif strcmpi(ALPHA, 'aa')
    MAX_BITS = 4.5;
end

if isempty(CUTOFF)
    CUTOFF = 0.5*MAX_BITS;
end


%% Calculate the actual seqlogo.
wm = seqlogo(SEQ, varargin{:}, 'displaylogo', false);


%% Generate the letters
letters = wm{1};
letter_wins = cell(size(letters));
[~, loc] = ismember(letters, colors(:,1));
loc(loc == 0) = size(colors,1);
clr = cell2mat(colors(loc, 2)); % corresponding colors
for t = 1:numel(letters)
    hf = figure('position',[200 200 100 110],'color','w');
    ha = axes('parent',hf, 'visible','off','position',[0 0 1 1]);
    ht = text(50,55,letters(t),'color',clr(t,:),'units','pixels',...
        'fontsize',100,'fontweight','norm',...
        'vertical','mid','horizontal','center');
    F = getframe(hf); % rasterize the letter
    img = F.cdata;
    m = any(img < 255,3); % convert to binary image
    m(any(m,2),any(m,1))=1; % mask to cut white borders
    letter_wins{t} = reshape(img(repmat(m,[1 1 3])),[sum(any(m,2)) sum(any(m,1)) 3]);
    close(hf);
end


%% Use the letters to generate a figure

%create a "image" that will hold the final data
wmat = wm{2};
if isempty(npos)
    if isempty(TOPN)
        npos = find(any(wmat>CUTOFF,1));
    else
        [~, i] = sort(max(wmat,[],1), 'descend');
        npos = sort(i(1:TOPN));
    end
end

fig_data = 255*ones(RES(1), RES(2)*(length(npos)+1)+length(npos)*2,3);
bitscores = linspace(0, MAX_BITS, size(fig_data,1));
tick_pos = zeros(length(npos),1);
% place images of letters
for i=1:length(npos)
    [wms idx] = sort(wmat(:,npos(i)), 'descend'); % largest on the top
    bits = [flipud(cumsum(flipud(wms))); 0];
    let_data = letter_wins(idx(wms>0));
    for s=1:length(let_data)
        start_pos = find(bitscores>=bits(s),1);
        end_pos = find(bitscores<=bits(s+1),1, 'last');
        if isempty(start_pos) || isempty(end_pos) || end_pos > start_pos
            continue
        end
        img_win = imresize(let_data{s}, [start_pos-end_pos, RES(2)]);

        fig_data(start_pos-1:-1:end_pos, (i*RES(2)-RES(2)*.5:i*RES(2)+RES(2)*.5-1)+2*i,:) = img_win;
    end
    tick_pos(i) = i*RES(2)+2*i;
end
if ~isempty(handle)
    image(handle,[0 size(fig_data,2)], [0 MAX_BITS],fig_data./255)
else
    handle = image([0 size(fig_data,2)], [0 MAX_BITS],fig_data./255);
end
set(gca, 'ydir', 'normal', 'xtick', tick_pos, ...
        'userdata', tick_pos, 'xticklabel', npos);
xlabel('position')
ylabel('bits')


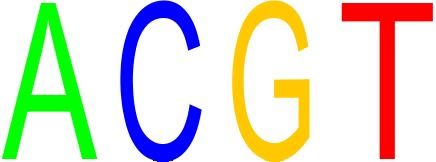
function colors = GetColors(alpha)
% get the standard colors for the sequence logo
if strcmpi(alpha, 'nt')
    colors = cell(6,2);
    colors(1,:) = {'A', [0 1 0]};
    colors(2,:) = {'C', [0 0 1]};
    colors(3,:) = {'G', [1 1 0]};
    colors(4,:) = {'T', [1 0 0]};
    colors(5,:) = {'U', [1 0 0]};
    colors(6,:) = {'', [1 0 1]};
elseif strcmpi(alpha, 'aa')
    colors = cell(21,2);
    colors(1,:) = {'G', [0 1 0]};
    colors(2,:) = {'S', [0 1 0]};
    colors(3,:) = {'T', [0 1 0]};
    colors(4,:) = {'Y', [0 1 0]};
    colors(5,:) = {'C', [0 1 0]};
    colors(6,:) = {'Q', [0 1 0]};
    colors(7,:) = {'N', [0 1 0]};
    colors(8,:) = {'A', [1 165/255 0]};
    colors(9,:) = {'V', [1 165/255 0]};
    colors(10,:) = {'L', [1 165/255 0]};
    colors(11,:) = {'I', [1 165/255 0]};
    colors(12,:) = {'P', [1 165/255 0]};
    colors(13,:) = {'W', [1 165/255 0]};
    colors(14,:) = {'F', [1 165/255 0]};
    colors(15,:) = {'M', [1 165/255 0]};
    colors(16,:) = {'D', [1 0 0]};
    colors(17,:) = {'E', [1 0 0]};
    colors(18,:) = {'K', [0 0 1]};
    colors(19,:) = {'R', [0 0 1]};
    colors(20,:) = {'H', [0 0 1]};
    colors(21,:) = {'', [210/255 180/255 140/255]};
else
    error('SeqLogoFigure:BADALPHA', ...
            'An unknown alphabet was provided: %s', alpha)
end

我已将此提交给 Mathworks FileExchange ... 批准后,我会发布一个链接。

我唯一烦恼的是,当它创建字母图像时,它会快速显示小图形窗口。如果有人知道可以避免的技巧,我很乐意听到。

编辑:Mathworks 已批准我提交的文件...您可以在此处的 FileExchange 下载它:http: //www.mathworks.com/matlabcentral/fileexchange/27124

于 2010-03-30T23:28:13.243 回答
1

关于 x 轴,该图似乎不包含标准轴(findobj(handle,'type','axes')为空),而是com.mathworks.toolbox.bioinfo.sequence.SequenceLogo类的自定义对象...

在不相关的注释中,您可以用更简单的调用替换您的第一行:

wide_seqs = reshape(randseq(200*500),[],200);
于 2010-03-27T06:18:22.137 回答
0

如果轴是一个 java 对象,那么您可能希望使用uiinspect查看它的方法和属性。这可能会让您知道您应该编辑什么以获得您想要的行为(不幸的是,我没有工具箱,所以我无法为您查找)。

于 2010-03-27T12:32:03.883 回答