For some reason, I don't believe that the identify method is supported
in the car package (the source of qqPlot())
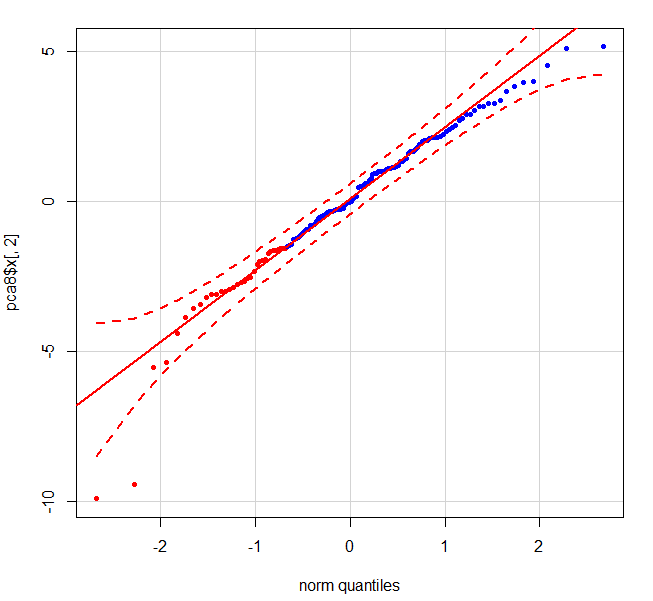
Let's take a look at a PCA of the USArrests data...
pca <- prcomp(USArrests)
The plot of this using qqPlot is easy enough.
require(car)
qqPlot(pca$x[,2],pch = 20, col = c(rep("red", 33), rep("blue", 99)))
However, qqPlot() does not allow for point selection via identify().
identify(qqPlot(pca$x[,2],pch = 20, col = c(rep("red", 33), rep("blue", 99))))
# numeric(0)
You can, however, make use of qqnorm() in the stats package.
identify(qqnorm(pca$x[,2],pch = 20, col = c(rep("red", 33), rep("blue", 99))))
This will produce a less sophisticated graph, but you should be able to add a line and confidence intervals manually via qqline() (also in stats) and a little more math.