R 中是否有一个包可以让我在 3D 旁边绘制多个时间序列?
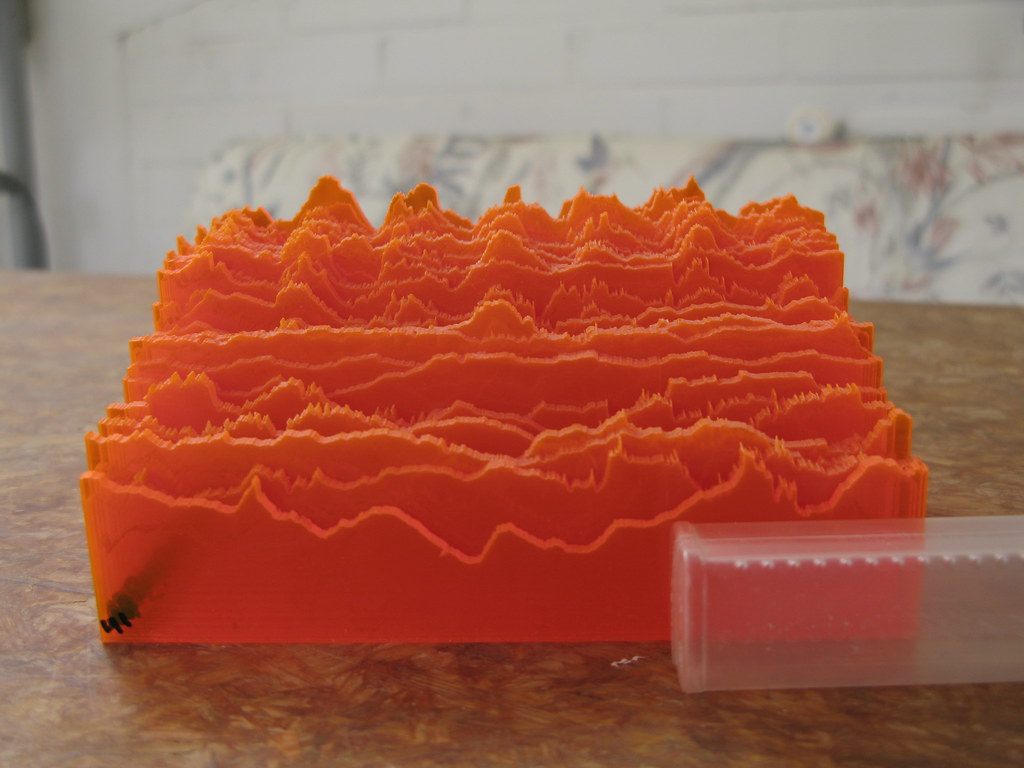
就像下面的例子:
http://farm6.staticflickr.com/5142/5619005462_5eab3c8cdd_b.jpg
http://synoptic.weaintplastic.com/
谢谢
R 中是否有一个包可以让我在 3D 旁边绘制多个时间序列?
就像下面的例子:
http://farm6.staticflickr.com/5142/5619005462_5eab3c8cdd_b.jpg
http://synoptic.weaintplastic.com/
谢谢
您是否从 quantmod 包中检查了 chartSeries3d0?
这是我在 quantmod.com 上找到的一个示例:
library(quantmod)
source("http://www.quantmod.com/examples/chartSeries3d/chartSeries3d.alpha.R")
getSymbols("DGS1MO;DGS3MO;DGS6MO;DGS1;DGS2;DGS3;DGS5;DGS7;DGS10;DGS20;DGS30",src="FRED")

TR <- merge(DGS1MO,DGS3MO,DGS6MO,DGS1,DGS2,DGS3,DGS5,DGS7,DGS10,DGS20,DGS30, all=FALSE)

colnames(TR) <- c("1mo","3mo","6mo","1yr","2yr","3yr","5yr","7yr","10yr","20yr","30yr")

TR <- na.locf(TR)

chartSeries3d0(TR["2011"])