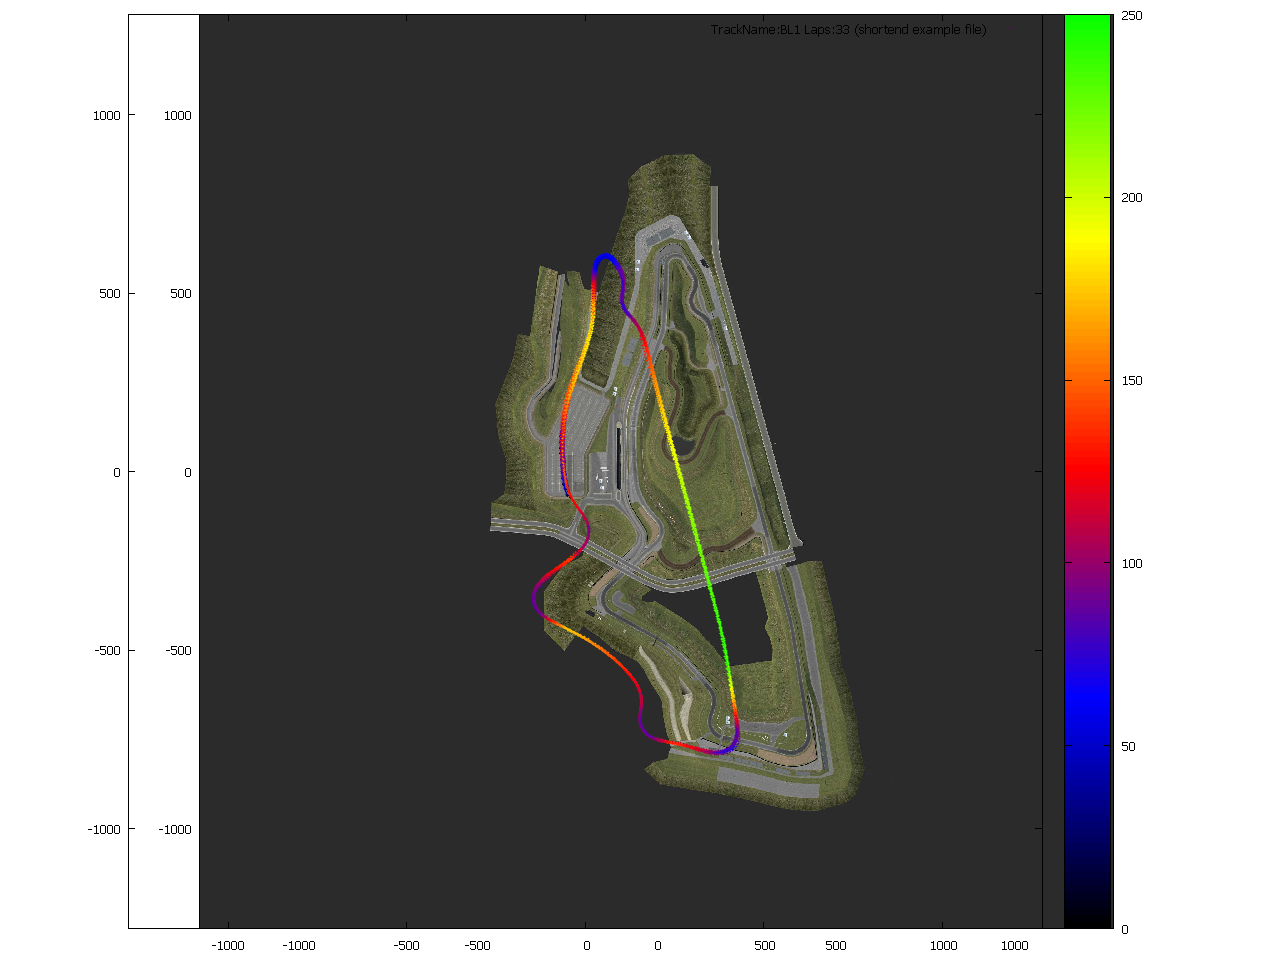
我的问题是在图像上绘制一个图。该图像不仅是一个很好的背景,而且应该与情节保持一致。
该图是许多彩色点,代表汽车在坐标系中的速度和位置。这样可行。
现在我想将情节与道路图像对齐,但我遇到了问题。
数据文件如下所示:
-60.2501 106.115 0 0
-68.1729 98.0388 0 0
[...]
x-pos, y-pos,speed, 忽略最后一个数字
这是我到目前为止所拥有的:
set multiplot

set yrange [-1280:1280]
set xrange [-1280:1280]
# set xrange [-1470:1280]

set size ratio 1
plot 'BL.jpg' binary filetype=jpg origin = (-1280,-1280) with rgbimage

set origin 0, 0
set size ratio 1

set yrange [-1280:1280]
set xrange [-1280:1280]
set key autotitle columnhead
set palette defined (0 "black", 0.25 "blue", 0.5 "red", 0.75 "yellow", 1 "green")
plot 'output.txt' using 1:2:3 with points palette pt 6 ps 0.1

unset multiplot
可悲的是,沿 x 轴它没有排列:
http://www.abload.de/img/doesnotlineuposs6n.png(1280 x 960 像素,311KB)
通过调整一些数字,我可以把它排成一行,但这只是随机猜测。
我尝试在set multiplot之后添加它:
set lmargin at screen 0.1
set rmargin at screen 0.98
set tmargin at screen 0.98
set bmargin at screen 0.2
这会导致更好的拟合,但现在比例是错误的?

用人民币选择矩形放大时道路图像也会消失吗?
链接到示例数据文件和跟踪图像: http: //pastebin.com/e5Yy5BaZ (对不起,该网站不允许我发布超过 2 个链接(需要 10 个声望))
