我很难获得一条线来渲染 - 我怀疑它与日期格式或 x 轴范围有关,因为我将线视为宽度为 -1 的 svg。
我是 D3 的新手,并试图用它来绘制每支球队在过去所有 NFL 赛季中的历史。X 轴是年份,Y 轴是他们的胜率,数值在 0-1 之间。
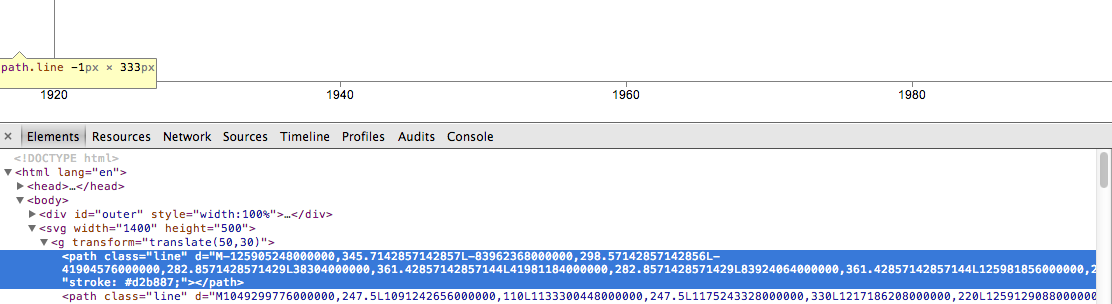
我可以让图表呈现两个轴但没有线。检查元素时,我看到应该是线的路径,但是当我将鼠标悬停时,它显示为“path.line -1px x 333px”。1
该行的路径是
<path class="line" d="M-125905248000000,345.7142857142857C-118914768000000,345.7142857142857,-97962480000000,298.57142857142856,-83962368000000,298.57142857142856S-55904688000000,282.8571428571429,-41904576000000,282.8571428571429S-13942656000000,361.42857142857144,38304000000,361.42857142857144S28000224000000,282.8571428571429,41981184000000,282.8571428571429S69923952000000,361.42857142857144,83924064000000,361.42857142857144S111981744000000,282.8571428571429,125981856000000,282.8571428571429S153943776000000,282.8571428571429,167924736000000,282.8571428571429S195886656000000,377.14285714285717,209867616000000,377.14285714285717S237810384000000,314.2857142857143,251810496000000,314.2857142857143S279868176000000,345.7142857142857,293868288000000,345.7142857142857S321830208000000,247.5,335811168000000,247.5S363773088000000,220,377754048000000,220S405696816000000,412.5,419696928000000,412.5S447754608000000,330,461754720000000,330S489716640000000,244.44444444444446,503697600000000,244.44444444444446S531659520000000,220,545640480000000,220S573583248000000,247.5,587583360000000,247.5S615641040000000,302.5,629641152000000,302.5S657603072000000,247.5,671584032000000,247.5S699545952000000,88,713526912000000,88S741469680000000,165,755469792000000,165S783527472000000,192.5,797527584000000,192.5S825489504000000,220,839470464000000,220S867432384000000,137.5,881413344000000,137.5S909356112000000,110,923356224000000,110S951413904000000,220,965414016000000,220S993375936000000,247.5,1007356896000000,247.5S1035318816000000,247.5,1049299776000000,247.5S1077242544000000,357.5,1091242656000000,357.5S1119300336000000,275,1133300448000000,275S1161262368000000,275,1175243328000000,275S1203205248000000,357.5,1217186208000000,357.5S1245128976000000,165,1259129088000000,165S1287186768000000,247.5,1301186880000000,247.5S1329148800000000,192.5,1343129760000000,192.5S1371091680000000,220,1385072640000000,220S1413015408000000,220,1427015520000000,220S1455073200000000,357.5,1469073312000000,357.5S1497035232000000,165,1511016192000000,165S1538978112000000,247.5,1552959072000000,247.5S1580901840000000,220,1594901952000000,220S1622959632000000,82.5,1636959744000000,82.5S1664921664000000,137.5,1678902624000000,137.5S1706864544000000,82.5,1720845504000000,82.5S1755797904000000,247.5,1762788384000000,247.5" style="stroke: #d2b887;"></path>
在尝试调试时,如果我在 X 轴上使用整数而不是日期,我可以使线条渲染得很好。
一切正常,直到我决定将数据格式从 CSV 更改为 JSON。我目前使用的格式看起来像
[{"color": "#D2B887", "seasons": [{"record": 0.21428571428571427, "wins": "3", "ties": "0", "losses": "11", "year": "1967"}, {"record": 0.32142857142857145, "wins": "4", "ties": "1", "losses": "9", "year": "1968"}], "display_name": "New Orleans Saints", "team": "aints"}]
我正在使用
d3.time.format("%Y").parse;
域是使用设置的
x.domain([parseDate("1920"), parseDate("2013")]);
我验证使用console.log()日期格式为“Sun Jan 01 2006 00:00:00 GMT-0800 (PST)”
完整代码在这里
<!DOCTYPE html>
<html lang="en">
  <head>
    <meta charset="utf-8">
    <title>NFL Standings</title>
    <script type="text/javascript" src="d3.v3/d3.v3.js"></script>
    <script type="text/javascript">
      var _gaq = _gaq || [];
      _gaq.push(['_setAccount', 'UA-19251792-1']);
      _gaq.push(['_trackPageview']);

      (function() {
      var ga = document.createElement('script'); ga.type = 'text/javascript'; ga.async = true;
      ga.src = ('https:' == document.location.protocol ? 'https://ssl' : 'http://www') + '.google-analytics.com/ga.js';
      var s = document.getElementsByTagName('script')[0]; s.parentNode.insertBefore(ga, s);
  })();

    </script>
<style> /* set the CSS */

body { font: 12px Arial;}

path {
    stroke: LightGray;
    stroke-width: 2;
    fill: none;
}

.axis path,
.axis line {
    fill: none;
    stroke: grey;
    stroke-width: 1;
    shape-rendering: crispEdges;
}

</style>
<body>

<div id="outer" style="width:100%">
    <div id="inner" style="display:table;margin:0 auto;">
<h1>NFL Win Percentages</h1>

<script type="text/javascript">
// Set the dimensions of the canvas / graph
var margin = {top: 30, right: 20, bottom: 30, left: 50},
    width = 1400 - margin.left - margin.right,
    height = 500 - margin.top - margin.bottom;

// Parse the date / time
var parseDate = d3.time.format("%Y").parse;

// Set the ranges
var x = d3.time.scale().range([0, width]);
var y = d3.scale.linear().range([height, 0]);

// Define the axes
var xAxis = d3.svg.axis().scale(x)
    .orient("bottom").ticks(5);

var yAxis = d3.svg.axis().scale(y)
    .orient("left").ticks(5);

// Define the line
var valueline = d3.svg.line()
    .x(function(d, i) { return x( parseDate(d.year) ) })
    .y(function(d) { return y( d.record ) })
    .interpolate("monotone");

// Adds the svg canvas
var svg = d3.select("body")
    .append("svg")
        .attr("width", width + margin.left + margin.right)
        .attr("height", height + margin.top + margin.bottom)
    .append("g")
        .attr("transform", "translate(" + margin.left + "," + margin.top + ")");

var team_season_data;

// Iterate over each team and plot the line for that team
d3.json("data/nfl_team_season_data.json", function(error, json) {
    if (error) return console.warn(error);
        team_season_data = json;

    // Add the valueline paths
    svg.selectAll("path")
        .data(team_season_data)
        .enter()
        .append("path")  // Add the valueline path.
            .attr("class", "line")
            .style("stroke", function(d) {
                return d.color;
            })
            .attr("d", function(d) {
                return valueline(d.seasons);
            })
        .on("mouseover",function(d) {
            d3.select(this).style("stroke", function(d) {
                return d.color;
            })
        })
        .on("mouseout",function(d) {
            d3.select(this).style("stroke", "LightGray")
        });

    // Scale the range of the data
    x.domain([parseDate("1920"), parseDate("2013")]);
    y.domain([0, 1]);

    // Add the X Axis
    svg.append("g")
        .attr("class", "x axis")
        .attr("transform", "translate(0," + height + ")")
        .call(xAxis);

    // Add the Y Axis
    svg.append("g")
        .attr("class", "y axis")
        .call(yAxis);
});

</script>
</div //inner>
</div //outer>
</body>
请参阅http://bl.ocks.org/GregKroleski/6124514上的工作要点
有任何想法吗?