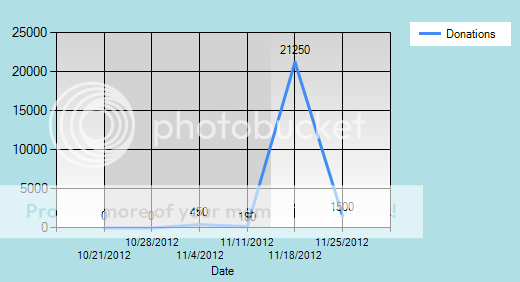
我正在用 C# 制作一个链接到捐赠数据的图表。每周,总捐款记录在表格中。该图表提取这些数字并将它们绘制成折线图。
我遇到的问题是每周都被记录为一周中的一天,因此应该基于周工作的控件无法正常工作。我附上了我的代码和下面的结果图片。
我想知道为什么这里的每个数据点都显示为一周中的一天。这是我加载数据的方式吗?
感谢您提供的任何帮助。
这是我的代码:
        #region Chart4
        string DonationSelect = this.DonationSelect.SelectedValue;
        Time = Convert.ToInt32(DonationSelect);

        if (Time > 3)
            Chart4.Series[0].IsValueShownAsLabel = false;
        else
            Chart4.Series[0].IsValueShownAsLabel = true;

        Chart4.Series[0].ChartType = SeriesChartType.Line;
        Chart4.ChartAreas["ChartArea1"].AxisX.IsMarginVisible = true;

        StartDate = GetNextDay(DateTime.Today, DayOfWeek.Sunday);
        TargetDate = GetNextDay(StartDate.AddMonths(-1 * Time), DayOfWeek.Sunday);

        for (DateTime i = TargetDate; i <= DateTime.Now; i = i.AddDays(7))
        {
            int Donations = 0;
            var oDonation = oDatabase.ExecuteScalar(@"SELECT Offering FROM
            tblStats WHERE Date=@Date",
                "Date", i);

            if (oDonation != null && oDonation != DBNull.Value)
            {
                Donations = Convert.ToInt32(oDonation);
            }
            //int Attendance = Convert.ToInt32();

            string Date = i.ToShortDateString();

            Chart4.Series[0].Points.AddXY(Date, Donations);
        }

        StripLine StripLine = new StripLine();

        StripLine.BackColor = Color.LightGray;
        StripLine.Interval = 1;
        StripLine.IntervalType = DateTimeIntervalType.Weeks;
        StripLine.StripWidth = .5;
        StripLine.StripWidthType = DateTimeIntervalType.Weeks;
        StripLine.IntervalOffset = 0;
        StripLine.IntervalOffsetType = DateTimeIntervalType.Days;

        Chart4.Legends.Add(new Legend("Legend3"));
        Chart4.Series[0].Legend = "Legend3";
        Chart4.Series[0].IsVisibleInLegend = true;
        Chart4.Series[0].LegendText = "Donations";
        Chart4.BorderSkin.SkinStyle = BorderSkinStyle.Emboss;
        Chart4.BackColor = Color.PowderBlue;
        Chart4.Series[0].BorderWidth = 3;
        Chart4.Series[0].BorderColor = Color.Orange;
        Chart4.ChartAreas["ChartArea1"].AxisX.Title = "Date";
        Chart4.ChartAreas["ChartArea1"].BackColor = Color.LightGray;
        Chart4.ChartAreas["ChartArea1"].BackSecondaryColor = Color.White;
        Chart4.ChartAreas["ChartArea1"].BackGradientStyle = GradientStyle.TopBottom;
        Chart4.ChartAreas["ChartArea1"].AxisX.StripLines.Add(StripLine);
        #endregion