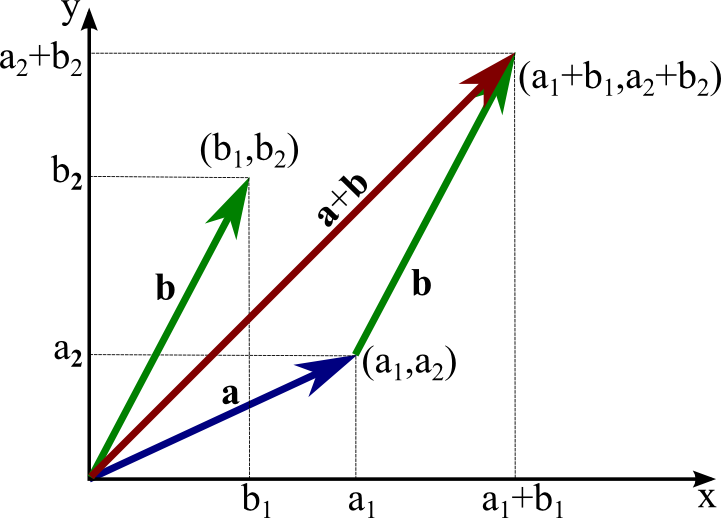
我正在寻找有关在笛卡尔平面上绘制矢量的建议。任务是绘制点(坐标),然后用箭头将它们链接到某个源点(比如 0,0)。下面的图片应该给出一个想法。我不关心颜色和命名向量/点,它只是在坐标平面上绘制箭头。我确信R(或python)中存在一些用于绘制线性代数向量和运算的库。
任何指针将不胜感激!

(来源:mathinsight.org)
我正在寻找有关在笛卡尔平面上绘制矢量的建议。任务是绘制点(坐标),然后用箭头将它们链接到某个源点(比如 0,0)。下面的图片应该给出一个想法。我不关心颜色和命名向量/点,它只是在坐标平面上绘制箭头。我确信R(或python)中存在一些用于绘制线性代数向量和运算的库。
任何指针将不胜感激!
(来源:mathinsight.org)
或者你可以arrows在 R 中使用函数。
plot(c(0,1),c(0,1))
arrows(0,0,1,1)
plot(NA, xlim=c(0,5), ylim=c(0,5), xlab="X", ylab="Y")
vecs <- data.frame(vname=c("a","b","a+b", "transb"),
                   x0=c(0,0,0,2),y0=c(0,0,0,1), x1=c(2,1,3,3) ,y1=c(1,2,3,3),
                   col=1:4)
with( vecs, mapply("arrows", x0, y0, x1,y1,col=col) )
如果将 lwd=3 添加到arrows调用中,它看起来会好一些。该text函数将允许标记并且可以使用“srt”参数进行旋转。
plot(NA, xlim=c(0,5), ylim=c(0,5), xlab="X", ylab="Y", lwd=3)
 with( vecs, mapply("arrows", x0, y0, x1,y1,col=col,lwd=3) )
 with(vecs, mapply('text', x=x1[1:3]-.1, y=y1[1:3]+.1,
  labels=expression(list(a[1],a[2]), list(b[1],b[2]), list(a[1]+b[1],a[2]+b[2]) ) ))

请注意,调用中的list函数expression是 plotmath -call list,与常规 R 不同,list就像 plotmath-paste与常规不同一样paste。它不会尝试在父框架中评估其参数。为此,需要bquote或substitute可能需要使用sapplybe 来处理“内部”表达式。
绘制一些随机 2 级向量的 Easy(TM) 方法。我首先计算欧几里得范数,否则箭头函数将绘制箭头从一个点到另一个点创建一个三角形,这很好解释,但不是我们想要的。其余的很简单:
#first some vectors
v1<-c(-3,5)
v2<-c(2,-10)
v3 <-c(0,-3)
v4 <- c(2,5)
# This one for the coordinates of the plot
ax<-c(-10,10)
# I will need the euclidean norm (two-norm) of the vectors:
mag <- function(x) sqrt(sum(x^2))
# I call plot to set up the "canvas"
plot(ax,ax,main="Test")
# I do the stuffz, the FIRST pair of params is the ORIGIN
arrows(0,0, mag(v1),mag(v2),lwd=4,col="red")
arrows(-2,1, mag(v3),mag(v4),lwd=4,col="blue")
最明显的做法是使用 python 的matplotlib包,它有很多绘图功能。
具体来说,您想对这个示例进行逆向工程。
另一种获得好结果的方法,以一种更具艺术性和更少笛卡尔的方式,是使用rsvg. 我从未尝试过,但 SVG 应该具有对箭头的原生支持。此外,如果需要,可以在 Inkscape 等绘图程序中编辑 SVG 文件。
查看matlib 包。
library(matlib)
#setting up the plot
xlim <- c(0,6)
ylim <- c(0,6)
par(mar=c(3,3,1,1)+.1)
plot(xlim, ylim, type="n", xlab="X1", ylab="X2", asp=1)
grid()
# define some vectors
a=c(4,2)
b=c(1,3)
# plot the vectors
vectors(b, labels="b", pos.lab=4, frac.lab=.5, col="green")
vectors(a, labels="a", pos.lab=4, frac.lab=.5)
vectors(a+b, labels="a+b", pos.lab=4, frac.lab=.5, col="red")
# vector a+b starting from a is equal to b.
vectors(a+b, labels="b", pos.lab=4, frac.lab=.5, origin=a, col="green")
